
A historical overlay is the most powerful landscape-reading tool that fits in a phone. It shows the former road, the vanished farmstead, the old river channel, the boundary the modern layer no longer carries. It is also the easiest way to fool yourself: a handsome match on screen looks like proof, and it is not.
The old sheet may have been surveyed on a different coordinate system, printed with distortion, scanned with a skew, generalised at a small scale, or referenced against landmarks that have themselves moved. Any of these shifts the layer — and almost always unevenly across the sheet.
The point is not to make the historical sheet stick perfectly to the satellite image. The point is to know where it agrees well enough, where and why it diverges, and what conclusion is permissible at all. For the symbols themselves see topographic symbols and reading old maps; a scan can be referenced in the browser with the Georeferencer.
An overlay is not a photograph of the past laid over the present. It is a model matching two sources of different accuracy.
The National Library of Scotland describes georeferencing as choosing a coordinate system and a transformation method, with control points that link positions on the old and the modern map. Different methods preserve shape, stretch the image or optimise local fit in different ways — so a perfect fit at one point guarantees nothing about the rest of the sheet.
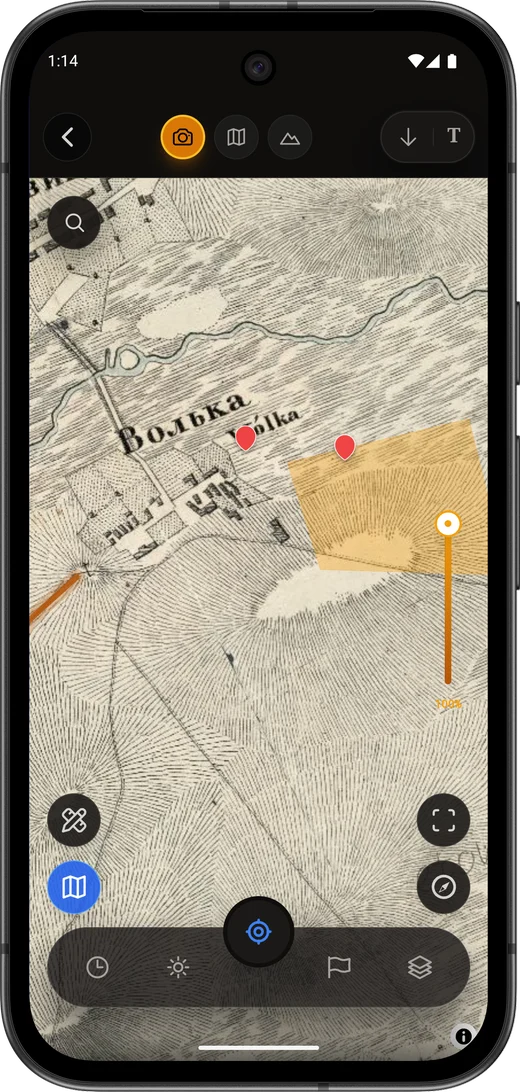
Why old maps drift
Drift is not always an app bug or a user error. The historical map and the modern base describe the same space in different languages: different geodesy, different survey technique, different printing. Sometimes the difference is not in the map at all but in the ground: the channel was straightened, the bridge moved, the road realigned, the village grew or disappeared.
It helps to sort the causes into three buckets straight away: source geometry, copy quality, landscape change. They are treated differently, and none of them is treated by nudging the layer by eye.
| Cause of divergence | How it shows up | Why one point will not fix it |
|---|---|---|
| Different coordinate system and projection | The whole sheet is systematically rotated or shifted, or drifts towards the edges | Map geometry needs a proper transformation, not a single manual nudge |
| Original survey method | An early sheet is accurate in some places and weak in others | Historical accuracy is uneven by definition |
| Print, scan and sheet distortion | The neatline and edges behave differently from the centre | A scan adds its own skew on top of the original map |
| Small scale and generalisation | Roads, rivers and buildings are drawn schematically | A symbol is not obliged to match the real width or axis of a feature |
| Landscape change | A channel, bridge, junction, bank or built-up area no longer matches the old picture | A modern feature is not always usable as a control point |
| Poor control points | The layer sits well in the centre and visibly floats at the edges | Landmarks may be dependent on each other, or unstable |
| Over-aggressive fitting | A few points match perfectly while the rest of the geometry looks unnatural | Local accuracy can destroy the overall shape of the source |
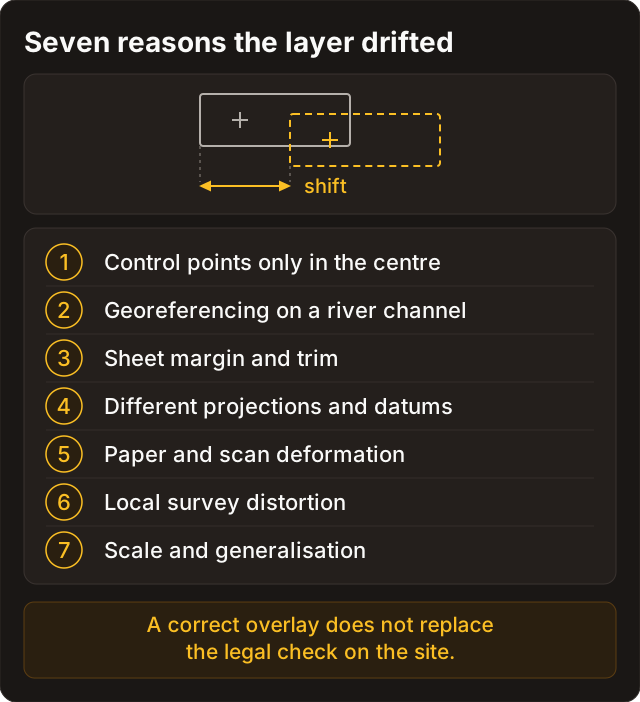
Source geometry. A Shubert three-verst sheet, a Red Army (RKKA) sheet and a modern web base are three different mathematics. If the layer is systematically rotated or drifts towards the edges, that is not a sloppy georeference but a projection mismatch: a manual nudge fits the centre and increases the error at the neatline at the same time.
Copy quality. Paper stretches and shrinks with humidity, multi-colour printing offsets the plates, and a flatbed scan adds a skew of its own — worst at the folds and along the edge. A copy assembled from several passes can have different geometry in different parts of the same image.
Scale generalisation. On a three-verst sheet a road symbol stands for a band tens of metres wide on the ground. The symbol is not obliged to sit on the real axis of the feature: that is the language of the map, not an error in it. More on this in roads, crossings and linear features.
Landscape change. The most treacherous group, because it looks like a georeferencing error. The channel was straightened, the bridge moved, the junction rebuilt — and the fit fails for reasons that have nothing to do with geodesy. What is stable here and what is not is covered in relief and water on historical maps.
Seven checks before you conclude anything
Checking an overlay is not a set of technical buttons. It is a short sequence of questions that separates an observation from a confident but weak hypothesis. Work through them in order: each one only makes sense once the previous one has a clear answer.
| Check | Question | A good outcome |
|---|---|---|
| 1. Sheet passport | Which series, year, scale, sheet number and scan source? | You know how detailed and how old the source actually is |
| 2. Neatline and grid | Is the neatline intact; are the coordinate grid and projection legible? | You have the raw material to understand the map geometry |
| 3. Independent landmarks | Do several features of different kinds agree, rather than one straight road? | The check does not rest on a single convenient match |
| 4. Edges and centre | Does the layer behave the same way across the sheet? | You can see whether the error is overall or local |
| 5. Relief and water | Have channels, banks, gullies or embankments changed? | Unstable landmarks are not used as the only anchor |
| 6. Adjacent sheet and another period | Does the feature repeat on another sheet, or in a later and an earlier source? | The hypothesis gains independent confirmation |
| 7. Confidence level | What exactly is confirmed, and where does the tolerance remain? | The conclusion is no stronger than the data behind it |
The first two checks happen before the layer ever reaches the screen. The sheet passport — series, year, scale, sheet number, scan source — decides what accuracy it is reasonable to expect: Red Army and General Staff sheets and 18th-century estate surveys belong to completely different accuracy classes, and demanding metre-level agreement from the latter is pointless.
The neatline and the coordinate grid are the second anchor. A copy cropped to the image loses the main key to the geometry of the sheet: the grid shows how the projection behaves, the neatline shows whether the sheet is complete at all. With neither, the georeference rests entirely on landmarks, and the demands on those landmarks rise sharply.
Checks three to six are about data: independent landmarks, how the layer behaves in the centre and at the edges, how stable the chosen features are, and confirmation from a second source. The seventh is about how you word the conclusion — and it is the one most often skipped.
Control points: independent, not merely convenient
A control point is a place you can confidently match on both the old and the modern source; pairs of such points are what tie the historical map image to the modern base. But for practical map reading the quality and independence of the points matters more than their number.
| Poor choice as the only anchor | Why it is risky | A sounder way to check |
|---|---|---|
| A single river bend | Channels move, get straightened and are generalised at small scales | Match several different kinds of landmark in different parts of the sheet |
| A modern bridge | The bridge may have been rebuilt or moved, and the approaches redrawn | Use it only alongside stable features and historical sheets |
| A long straight road | The fit may be a visual illusion; the road may have been realigned | Check junctions, settlements, relief and neighbouring features |
| A single church | The building may be gone, rebuilt, or wrongly matched to its label | Compare against several landmarks and the archival context |
| The centre of one settlement | Built-up boundaries move, and the map generalises features | Cross-check against stable relief and infrastructure |
A good check uses landmarks that do not repeat the same error. Three points along one straight highway create the appearance of control without really testing the sheet: they lie on a single line and say nothing about rotation and scale across it. A combination of different elements — a stable relief line, a major road junction, a confidently identified labelled feature — gives a more honest picture.
Labels are a trap of their own. A name on the sheet may belong to a different feature from the one you are treating as a landmark, and an abbreviation can read differently across series. Before you make a church or a farmstead an anchor point, check the lettering against labels, abbreviations and lettering.
A practical rule: the points you used to georeference the sheet cannot be used to verify that same georeference. Verify on features that took no part in the fit.
Local accuracy and overall accuracy
A historical sheet can sit beautifully in one district and diverge in another. That is not always a reason to discard it entirely. What matters is which question you are asking.
| Type of accuracy | What it means | When it is enough |
|---|---|---|
| Overall | The sheet keeps a reasonable shape and position across a large area | For understanding landscape structure, routes and how features relate to each other |
| Local | One particular area agrees well with the modern base | For cautious interpretation in a small zone, backed by several independent checks |
| Visual | The layers look neatly aligned, but few checks have been made | For a preview only, never for deciding what to do on the ground |
The National Library of Scotland guide describes separately the transformations that handle rotation, scaling, stretching and rubber-sheeting of a historical map in different ways. A method that optimises accuracy at the control points can deliver a good local fit at the cost of the overall geometry: the sheet sits perfectly where you placed a point and visibly floats between points.
Do not carry confidence from one perfectly matched point across the whole sheet. Overlay accuracy is not a single number but a map of unevenness: metres in one place, hundreds of metres in another.
Hence a practical habit: before drawing a conclusion, look at the layer in four or five places around the area of interest, not only at the most interesting point. If the divergence grows steadily from centre to edge, that is geometry. If it jumps around, it is the scan, the changed landscape, or poor control points.
When to re-reference the sheet or replace it
Divergence is not a death sentence for a source. But there is no sense in tolerating it either: an overlay you know to be wrong by an unknown amount carries no information at all.
- Check that the modern layer has not drifted itself — compare a GPS point against an obvious landmark on the ground.
- Read the character of the error: systematic rotation growing towards the edges is projection; local jumps are the points or the scan.
- Find a sheet from the same series at better resolution and with the neatline intact.
- Re-reference on landmarks spread across the whole area of interest rather than one corner — in the browser that is done in the Georeferencer.
- Verify the result on features that took no part in the fit.
- If the agreement is still unsatisfactory, take an adjacent sheet or another period and test the hypothesis there.
- Record the residual error in words: tens of metres in the centre, markedly worse towards the north-east neatline.
Changing source is often more honest than a heroic struggle with the georeference. Where to look for other editions and what exists for a given region is in archives of Russia and Belarus, and the full path from map to archival document is worked through in the case study.
Not mistaking a pretty fit for proof
It is natural to want the modern ground to confirm a line on an old map. But a similar band on a satellite image can be a road, a drain, a field edge, a forest ride, a shadow, a machinery track or a compression artefact. So the analysis is phrased on three levels: observation, hypothesis, verification.
| Level | Sound wording | Unsound wording |
|---|---|---|
| Observation | The historical sheet carries a linear symbol; the modern image shows a light band in the same area | That is definitely an old road |
| Hypothesis | The band may relate to a former route; the legend, an adjacent sheet and a georeference check are needed | The map shows a ready-made route |
| Verification | Three independent landmarks agree; the adjacent sheet confirms the line; accuracy near the edge is lower | No further sources are needed |
The difference between these wordings is not stylistic. Saying it is definitely an old road closes the question and removes any need to check. Saying the sheet carries a linear symbol and the image shows a light band nearby keeps the hypothesis alive and testable. In a month the second wording still means something; the first has become a memory with no data behind it.
This care matters most near heritage, protected areas and complicated contexts. A map helps you frame a research question; it grants no right to intervene.
A correct overlay does not replace the legal check on a plot. A match on screen grants no permission, does not change the status of the land and does not lift a protection regime — legal status is checked separately, see legal status. At any sign of a cultural layer, a burial or ordnance, work stops and the local procedure takes over, not your route plan.
A confidence card in Discovera
Instead of a single note saying found it on an old map, keep a short verification card. It keeps the hypothesis intelligible a month later and lets you compare the quality of different sources.
| Card field | Example |
|---|---|
| Map | Shubert, sheet…, edition…, scale… |
| Modern base | Satellite layer, date viewed… |
| Control landmarks | Fit checked against …; not used as points … |
| Accuracy zone | The centre of the sheet fits markedly better than the north-east neatline |
| Hypothesised feature | Linear symbol with a label; the reading needs the legend |
| Supporting sources | Adjacent sheet, modern relief, an archival map of another year |
| Confidence | High, medium or low — with a one-line reason |
| Legal status | Checked separately; the map is not a permission |
That card turns the overlay from a visual effect into a tidy research note. It works equally well for a personal journal and for a conversation with a specialist who needs to see what your hypothesis rests on. How to carry an observation through to a context record is in signal to context.
The card is filled in once and takes a couple of minutes. After that it works on its own: six months later you see not somewhere around here on the Shubert sheet, but a specific sheet, specific landmarks and an honestly recorded level of confidence.
FAQ
The old layer fits in the centre and diverges at the edges. Is it useless?
Not necessarily. It may still serve for overall structure, or for local reading in the zone where the fit is confirmed by independent landmarks. What you cannot do is extend the accuracy of the centre to the whole sheet — that is the classic overlay mistake.
How many control points are needed?
There is no magic number. What matters is that the points are independent, spread over the area rather than bunched in one corner, and represent different stable kinds of feature. For any meaningful interpretation, an extra check on landmarks that took no part in the original fit is worth the minute it costs.
Why not anchor on the river alone?
Channels move, and on small-scale maps they are generalised as well: a smooth line on paper can sit hundreds of metres from the real meander. A river can be a useful landmark, but it must not be the only anchor.
The overlay shows a former farmyard. Can I treat the point as exact?
Only if the georeference has been verified on independent features and you understand the local error in that part of the sheet. Even then a historical point remains a hypothesis about the past, not a permission to access or to intervene: legal status is checked separately.
Will AI georeference the map automatically?
It can speed up the search for matching landmarks and propose a fit, but it does not remove the need to check the series, the control points, the sheet distortion and the legal status of the area. Responsibility for the conclusion stays with the person.
How does an overlay on the phone differ from georeferencing in the browser?
The browser Georeferencer is better for placing control points carefully across a large scan; the phone is what you use to test the result on the ground and see your own GPS point over the layer. The practical side of offline layers is in old maps on your phone.
What to read next
- Topographic symbols — the shared language of modern and historical map legends.
- Roads, crossings and linear features — reading linear objects without false confidence.
- Labels, abbreviations and lettering — how to verify the text on a map.
- Old maps on your phone — offline layers, overlays and basic georeferencing.
- Reading old maps — versts, scale and the symbols of the three-verst sheets.
- Legal status — why a map is not a permission.